In previous blog posts, I have described how an FTDI USB device can be programmed in Python to access the SWD bus of an ARM microprocessor. This allows the internals of the CPU to be accessed, without disrupting the currently running program.
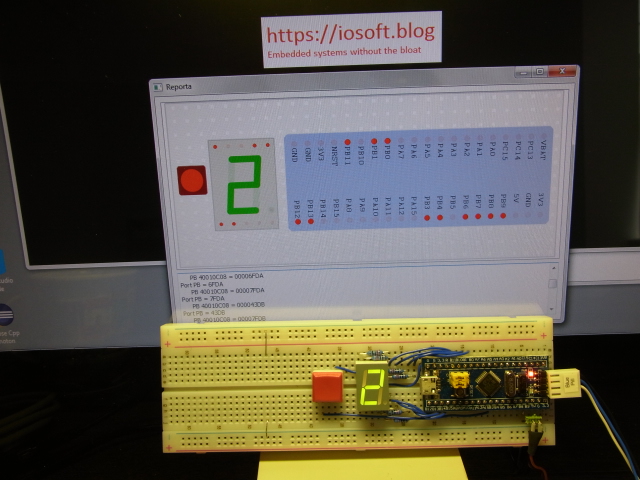
In this blog I take the process one step further, and add a graphical front-end, that shows the CPU activity in real time; if you want to see it in action, take a look at this video.
If you need a more powerful debug system, take a look at my post OpenOCD on the Raspberry Pi. I’ve also created a remote graphical front-end that uses a Web browser for display, instead of running PyQt locally, click here for details.
Hardware
The target system in the demonstration is a ‘blue pill’ STM32F103 board, with a 7-segment display and pushbutton. This CPU board is particularly convenient because it has a 4-pin connector with SWD clock & data; it can be seen on the right-hand side of the photograph above.
The SWD connection is described in detail in this post, in brief, the circuit is:
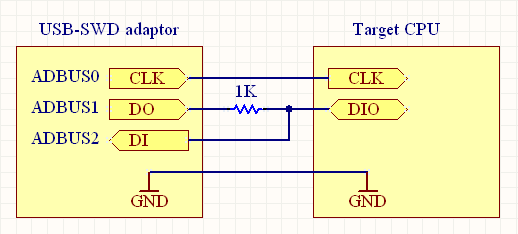
Take care when making any connections to power lines, especially the 5 volt line on the FTDI module; if mis-connected, high currents can flow, resulting in significant damage.
The demonstration system has a Kingbright SC56-11LGWA common-cathode 7-segment display; the anodes are driven directly from the CPU I/O pins with 220 ohm series resistors. The pin mapping (reading from top left of the display) is:
Segment   CPU Pin (via 220R)
g         PB11
f         PB10
a         PB1
b         PB0
e         PB12
d         PB13
c         PB14
DP        PB15

Button    PB3 (button shorts this pin to ground)
You may wonder why I have used such a complex mapping; why not use 8 consecutive pins? The answer is that the above arrangement makes the wiring easier, at the expense of a little software complexity. This trade-off is quite common in commercial projects, where the demands of cost-saving often lead to significant complexity in the hardware configuration.
Software
The full source code is available on Github, and is compatible with Python 2.7 or 3.x. It has been tested on Windows, and is theoretically Linux-compatible, except for a problem reading data back from USB, as described in the earlier blog – this issue needs to be resolved. The Python library dependencies are:
- PyQt v4 or v5 (GPL version)
- ftd2xx
- pypiwin32 (if running Python 3.x)
These can be installed with ‘pip’ or ‘pip3’ as usual.
PyQt
The following text describes how I created the graphical front-end, for the benefit of anyone wishing to understand or modify the code; this isn’t necessarily the best way, it is just what I did based on past experience.
There are many options for creating a GUI in Python; I’ve used PyQt in the past, so that is the option I’ve chosen here. In case you’re unfamiliar with it, the current version is 5, but many installations are still version 4, so I’ve written the code to be compatible with both, even though this does involve some manipulation of the libraries:
try:
    from PyQt5.QtGui import QBrush, QPen, QColor, QFont, QTextCursor, QFontMetrics, QPainter
    from PyQt5.QtWidgets import QApplication, QGraphicsScene, QGraphicsView, QGraphicsSimpleTextItem
    from PyQt5 import QtCore, QtWidgets
except:
    from PyQt4.QtGui import QBrush, QPen, QColor, QFont, QTextCursor, QFontMetrics, QPainter
    from PyQt4.QtGui import QApplication, QGraphicsScene, QGraphicsView, QGraphicsSimpleTextItem
    from PyQt4 import QtCore, QtGui as QtWidgets
It is possible to create the entire front-end graphically using Qt designer, then just import the GUI file and it will be displayed exactly as designed, so in theory you only need to write the event-handlers for the various actions. Personally, I find this approach a bit tricky when implementing more complex GUIs, so tend to use the PyQt function calls to build the graphics from scratch.
Main Window
The main window is as simple as possible, containing only one central widget:
class MyWindow(QtWidgets.QMainWindow, MyWidget):
    graph_updater = QtCore.pyqtSignal(str)

    def __init__(self, parent=None):
        QtWidgets.QMainWindow.__init__(self, parent)
        self.widget = MyWidget(self)
        self.setCentralWidget(self.widget)
        self.setWindowTitle(VERSION)
        self.resize(*WINDOW_SIZE)
        self.graph_updater.connect(self.widget.update_graph)
A ‘graph_updater’ signal is defined so that any thread can send a request to update the graphics; this will be queued until the main GUI thread is back in control, so there is no ambiguity over which thread is performing the updates.
The single widget contains all the graphical elements, and the hierarchy is important if they are to be displayed correctly; for example, if the window is resized, I want all the elements to be resized in proportion, and that is only possible if the correct parent-child relationship is maintained.
The upper area of the widget is graphics, the lower is text; they are combined using a vertical layout widget.
self.text = QtWidgets.QTextEdit()
self.scene = QGraphicsScene()
self.view = MyView(self.scene)
...
layout = QtWidgets.QVBoxLayout()
layout.addWidget(self.view, 30)
layout.addWidget(self.text, 10)
self.setLayout(layout)
Text display
The text area is used to display all kinds of diagnostic information, so it is convenient to redirect the console print function to display here. This is done by creating ‘write’ and ‘flush’ functions in the widget, which emit a signal linked to an updater function:
text_updater = QtCore.pyqtSignal(str)
...
self.text_updater.connect(self.update_text)
...
# Handler to update text display
def update_text(self, text):
    disp = self.text.textCursor()           # Move cursor to end
    disp.movePosition(QTextCursor.End)
    text = str(text).replace("\r", "")      # Eliminate CR
    while text:
        head,sep,text = text.partition("\n")# New line on LF
        disp.insertText(head)
        if sep:
            disp.insertBlock()
    self.text.ensureCursorVisible()    # Scroll if necessary

# Handle sys.stdout.write: update text display
def write(self, text):
    self.text_updater.emit(str(text))
def flush(self):
    pass
Now all that is necessary is to redirect console output to the main widget..
sys.stdout = self
..and magically anything in a ‘print’ function will appear in the text display. The PyQt Signal interface ensures there are no threading problems, you can still use the print function anywhere.
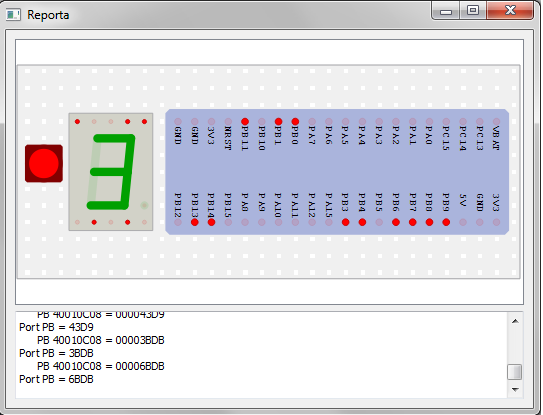
Graphical display
When displaying graphics, Qt (and hence PyQt) makes a distinction between the graphical objects (the ‘scene’) and their realisation on the screen (the ‘view’).
When first experimenting with background patterns, I discovered one (Dense1Pattern) that creates rows of holes similar to the prototyping board. Having fixed on this, it was logical to draw all objects with respect to this grid, i.e. in nominal units of 0.1 inches as on the prototyping board, though the graphics will expand or shrink when the window size is changed.
Drawing
To draw an object, it is just added to the scene, and it will automatically be displayed, for example to draw a circle:
# Add circle to grid, given centre
    def draw_circle(self, gpos, size, pen, brush=PIN_ON_BRUSH):
        size *= GRID_PITCH
        x,y = self.grid_pos(gpos)
        p = self.scene.addEllipse(0, 0, size, size, pen, brush)
        p.setPos(x-size/2.0, y-size/2.0)
        return p
You can see the conversions from screen-units to grid-units. One less-obvious aspect of this code is that the ellipse is originally drawn at the 0,0 origin, then moved into place, rather than being drawn at the final location; this simplifies any subsequent operations such as movement or rotation.
Animation
The drawing function returns the object that has been created, which must be saved somewhere, so it can be animated. The most obvious form of animation is to replace that object with another, e.g. one drawn in dark red to light red, but there is an easier way to modify any drawn object: change the opacity – the extent to which the object is transparent or opaque. If a bright red object is drawn with an opacity value of 0.1, it becomes a faint dark red; changing the opacity to 1.0 restores the full strong colour.
So the objects that are to be animated are stored as a list in a dictionary, indexed on the signal name (e.g. ‘PB10’); when that signal changes state, it is only necessary to walk the list, setting the opacity as required.
# Set pin (or segment) on/off state
# Format is 'name=value', e.g.  'PA10=1'
def set_pin(self, s):
    name, eq, num = s.partition('=')
    if eq and name in self.sigpins:
        val = int(num, 16)
        for p in self.sigpins[name]:
            if int(p.opacity()) != val:
                p.setOpacity(PIN_ON_OPACITY if val else PIN_OFF_OPACITY)
7-segment display
As it happens, PyQt has a widget to draw 7-segment displays, but in this case it is easier to animate if drawn from scratch. The standard segment notation is:
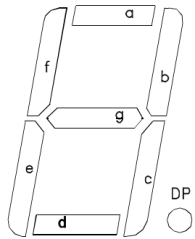
To draw this in one continuous operation, I start with segment F, then ABCDEG. Once drawn, the list is rearranged into ABCDEFGH order, where H is the decimal point.
SWD interface
The SWD interface uses an FTDI USB device as described in detail here. The software used in this project is very similar, but has been optimised to scan the I/O ports quite fast, around 100 times per second. The way this has been achieved is to group all the commands to the FTDI device together, so a single block of data requests is sent out over the USB bus, then a single block of responses is read back.
All the outgoing requests are buffered, rather than being sent individually – this is quite a simple change, you just have to remember to flush the buffer before reading back the results. However you then have the problem that the returned data block consists of the data from several requests – how do you work out which data value corresponds to which request? The method I’ve adopted is to create a polling list, with objects representing the memory addresses to be polled
poll_vars = []  # List of variables to be polled

# Storage class for variable to be polled
class Pollvar(object):
    def __init__(self, name, addr):
        self.name, self.addr = name, addr
        self.value = None

# Add variable to the polling list
def poll_add_var(name, addr):
    poll_vars.append(Pollvar(name, addr))
The data requests are generated by walking down the list, then when the responses arrive, the ‘value’ fields are filled in sequentially, or set to ‘none’ if there was an error.
# Send out poll requests
def poll_send_requests(h):
    for pv in poll_vars:
        swd.swd_wr(h, swd.SWD_AP, APORT_TAR, pv.addr, True, False)
        swd.swd_idle_bytes(h, 2)
        swd.swd_rd(h, swd.SWD_AP, APORT_DRW, True, False)
        swd.swd_rd(h, swd.SWD_AP, APORT_DRW, True, False)

# Get poll responses
def poll_get_responses(h):
    for pv in poll_vars:
        swd.swd_wr(h, swd.SWD_AP, APORT_TAR, pv.addr, False, True)
        swd.swd_rd(h, swd.SWD_AP, APORT_DRW, False, True)
        req = swd.swd_rd(h, swd.SWD_AP, APORT_DRW, False, True)
        pv.value = req.data.value if (req.data is not None and
                    req.ack.value==swd.SWD_ACK_OK) else None
It is slightly confusing that the request & response use the same swd_wr and swd_rd functions; the key to understanding this code is to look at the boolean values. ‘True, False’ means that a transmission is sent, but no data is read back; ‘False, True’ is the opposite, in that nothing is sent, the response is just read back.
If you want to see the SWD transactions, try setting swd.VERBOSE to True:
SWD interface: FT232H device in Single RS232-HS
Reporta

Rd 0 IDCODE  1BA01477 Ack 1
Wr 0 ABORT   0000001E Ack 1
Wr 4 CTRL    50000000 Ack 1
Rd 4 STATUS  F0000040 Ack 1
DP ident: 1BA01477
Wr 8 SELECT  000000F0 Ack 1
Rd C DRW/BD3 00003BDB Ack 1
Rd C DRW/BD3 14770011 Ack 1
AP ident: 14770011
Wr 8 SELECT  00000000 Ack 1
Wr 0 CSW/BD0 22000002 Ack 1
Wr 4 TAR/BD1 40010C08
Rd C DRW/BD3
Rd C DRW/BD3
Wr 4 TAR/BD1 40010C08 Ack 1
Rd C DRW/BD3 14770011 Ack 1
Rd C DRW/BD3 000043D9 Ack 1
..and so on..
Looking at the last block of 6 transactions, the first 3 are a write-cycle to the SWD TAR (transfer address) register, then a dummy read and the actaul read cycle. These are the requests being sent to the target system; nothing is being read back so the read-data & ack-status values are unknown. The second block of 3 are the readback of these requests, so the actual values are displayed.
An ‘ack’ value of anything apart from 1 is an error; a value of 0 or 7 suggests the target isn’t responding, 2 means it is trying to send a delayed response, and 4 indicates a hard error – this is sticky, so will persist until cleared by writing to the ‘abort’ register.
Code structure
The ‘reporta’ project source files on Github are:
reporta.py:   main program
rp_pyqt.py:   PyQt interface
rp_arm.py:    ARM processor definitions
rp_swd.py:    SWD interface
rp_ftd2xx.py: FTDI device driver
The lower 3 files are very similar to their counterparts in these posts, basically I’ve copied the files with minor modifications. Each file has a ‘main’ function to demonstrate its functionality; for example, you can see the PyQt interface running without the FTDI hardware, just by executing rp_pyqt.py
The main ‘reporta’ program has no command-line options, currently the I/O port of interest is hard-coded; to add other ports (or CPU memory locations) to the polling list, just use the poll_add_var function.
As with the previous posts, I must state that so far I’ve only tested this technique on the STM32F103 processors; others may require custom powerup sequences, or special incantations to gain access to the CPU memory – but hopefully my Python code will provide a useful starting-point.
Copyright (c) Jeremy P Bentham 2018. Please credit this blog if you are using the information or software in it.

Very nice posts, thank you!
I posted your blog to the STM32Duino forum (http://www.stm32duino.com/viewtopic.php?f=3&t=4519).
LikeLike
Glad you like them. I used the stm32duino toolset to compile the seven-segment program, and it works well, but I’m not keen on going back to ‘print’ statements (or Eclipse!) for debugging; watch this space for developments…
LikeLike