Raspberry Pi position detection using fiducial tags

Exif_JPEG_PICTURE

What is a fiducial?

You may not have heard the word ‘fiducial’ before; outside the world of robotics (or electronics manufacture) it is little known. It refers to an easily-detected optical marker that is added to an object, so its position can be determined by an image-processing system.

It is similar to a 2-dimensional QR barcode, but has a much simpler structure, so can be detected at a distance; the tags in the photo above are only 12 mm (0.5 inch) in size, but I’ve successfully detected them in an HD image at a distance of 1.6 metres (over 5 feet).

The image analysis returns the x,y position of the tag centre, and the coordinates of its 4 corners, which can be used to highlight the tag outline in the camera image display; there is also a ‘goodness factor’ that indicates how well the tag has been matched; this can be used to filter out some spurious detections.

There isn’t just one type of fiducial; several organisations have developed their own formats. The type directly supported by OpenCV is known as ArUco, but I’ve opted for a rival system developed by the University of Michigan, called AprilTag. They have a full set of open-source software to generate & decode the tags; the decoder is written in C, with Python bindings, so can easily be integrated into a Raspberry Pi image processing system.

The AprilTag package has several tag ‘families’, that are characterised by two numbers; the number of data bits in a square, and the hamming distance between adjacent tags, e.g. 16h5 is a 4-by-4 data square, with a hamming distance of 5. The hamming distance is used to remove similar-looking tags that might easily be confused for each other, including rotations, so although 16h5 has 16 data bits, there are only 30 unique tags in that family.

I’m using 3 of the simpler families: 16h5, 25h9 and 36h11. Here are the tag values of 0 to 2 for each of them:

apriltags_all

Generating Apriltag images

The original Apriltag generator here is written in Java, with the option of auto-generating C code. For simplicity, I’ve completely rewritten it in Python, with the option of outputting a bitmap (PNG/JPEG) or vector (SVG) file. The vector format allows us to generate tags with specific dimensions, that can accurately be reproduced by a low-cost laser printer.

To generate the tags, we need some ‘magic numbers’ that indicate which bits are set for a given tag. I got these numbers from the original Java code, for example Tag16h5.java has the lines:

public class Tag16h5 extends TagFamily
{
  public Tag16h5()
  {
    super(16, 5, new long[] { 0x231bL, 0x2ea5L, 0x346aL etc..
  }
}

I’ve copied the first 10 data entries from Tag16h5, 25h9 and 36h11 Java files:

tag16h5 =  16, 5,(0x231b,0x2ea5,0x346a,0x45b9,0x79a6,
                  0x7f6b,0xb358,0xe745,0xfe59,0x156d)
tag25h9  = 25, 9,(0x155cbf1,0x1e4d1b6,0x17b0b68,0x1eac9cd,0x12e14ce,
                  0x3548bb,0x7757e6,0x1065dab,0x1baa2e7,0xdea688)
tag36h11 = 36,11,(0xd5d628584,0xd97f18b49,0xdd280910e,0xe479e9c98,0xebcbca822,
                  0xf31dab3ac,0x056a5d085,0x10652e1d4,0x22b1dfead,0x265ad0472)

If you need more than 10 different tags of a given family, just copy more data values.

In my code, a tag is created as a 2-dimensional Numpy array, where ‘0’ is a black square, and ‘1’ is white. The source data is a right-justified bit-stream, for example the above value of 231b hex is decoded as follows:

There is a 1-bit solid black frame around the data bits, and an (invisible) 1-bit white frame round that. The encoder steps are:

  • Calculate the number of data bits per row by taking the square root of the area
  • Load the data for the required tag as an 8-byte big-endian value, convert it to a linear array of byte values
  • Convert the byte array into bits, discard the unused left-most bits, and reshape into a square array
  • Add a black (0) frame around the array
  • Add a white (1) frame around the black frame
# Generate a tag with the given value, return a numpy array
def gen_tag(tag, val):
    area, minham, codes = tag
    side = int(math.sqrt(area))
    d = np.frombuffer(np.array(codes[val], ">i8"), np.uint8)
    bits = np.unpackbits(d)[-area:].reshape((-1,side))
    bits = np.pad(bits, 1, 'constant', constant_values=0)
    return np.pad(bits, 2, 'constant', constant_values=1)

We now have a numpy array with the desired binary pattern, that needs to be turned into a graphic.

Bitmap output

The extension on the output filename (.png, .jpg, .pgm, or .svg) determines the output file format. If a bitmap is required, Python Imaging Library (PIL, or the fork ‘pillow’) is used to convert the list of tag arrays into graphic objects. The binary bits only need to be multiplied by 255 to provide the full monochrome value, then are copied into the image. This creates one-pixel squares that are invisible without zooming, so the whole image is scaled up to a reasonable size.

# Save numpy arrays as a bitmap
def save_bitmap(fname, arrays):
    img = Image.new('L', (IMG_WD,IMG_HT), WHITE)
    for i,a in enumerate(arrays):
        t = Image.fromarray(a * WHITE)
        img.paste(t, (i*TAG_PITCH,0))
    img = img.resize((IMG_WD*SCALE, IMG_HT*SCALE))
    img.save(fname, FTYPE)

PGM output is an old uncompressed binary format, that is rarely encountered nowadays: it can be useful here because it is compatible with the standard apriltag_demo application, which I’ll be describing later.

Vector output

The vector (SVG) version uses the ‘svgwrite’ library, that can be installed using pip or pip3 as usual. The tag size is specified by setting the document and viewport sizes:

    SCALE     = 2
    DWG_SIZE  = "%umm"%(IMG_WD*SCALE),"%umm"%(IMG_HT*SCALE)
    VIEW_BOX  = "0 0 %u %s" % (IMG_WD, IMG_HT)

This means each square in the tag will be 2 x 2 mm, so 4 x 4 data bits plus a 1-bit black frame makes the visible tag size 12 x 12 mm.

The background is defined as white, so only the black squares need to be drawn; the numpy ‘where’ operator is used to return a list of bits that are zero.

# Save numpy arrays as a vector file
def save_vector(fname, arrays):
    dwg = svgwrite.Drawing(fname, DWG_SIZE, viewBox=VIEW_BOX, debug=False)
    for i,a in enumerate(arrays):
        g = dwg.g(stroke='none', fill='black')
        for dy,dx in np.column_stack(np.where(a == 0)):
            g.add(dwg.rect((i*TAG_PITCH + dx, dy), (1, 1)))
        dwg.add(g)
    dwg.save(pretty=True)

Each tag is defined as a separate SVG group, which is convenient if it has to be copy-and-pasted into another image. If you are unfamiliar with SVG, take a look at my blog on the subject.

Source code for Apriltag generator

The source code (apriltag_gen.py) is compatible with Python 2.7 or 3.x, and can run on Windows or Linux. It requires numpy, svgwrite, and PIL/pillow to be installed using pip or pip3 as usual:

# Apriltag generator, from iosoft.blog

import sys, math, numpy as np, svgwrite
from PIL import Image

filename  = 'test.svg'  # Default filename (.svg, .png, .jpeg or .pgm)
family    = 'tag16h5'   # Default tag family (see tag_families)
NTAGS     = 10          # Number of tags to create
TAG_PITCH = 10          # Spacing of tags
WHITE     = 255         # White colour (0 is black)

# First 10 values of 3 tag families
tag16h5 =  16, 5,(0x231b,0x2ea5,0x346a,0x45b9,0x79a6,
                  0x7f6b,0xb358,0xe745,0xfe59,0x156d)
tag25h9  = 25, 9,(0x155cbf1,0x1e4d1b6,0x17b0b68,0x1eac9cd,0x12e14ce,
                  0x3548bb,0x7757e6,0x1065dab,0x1baa2e7,0xdea688)
tag36h11 = 36,11,(0xd5d628584,0xd97f18b49,0xdd280910e,0xe479e9c98,0xebcbca822,
                  0xf31dab3ac,0x056a5d085,0x10652e1d4,0x22b1dfead,0x265ad0472)
tag_families = {"tag16h5":tag16h5, "tag25h9":tag25h9, "tag36h11":tag36h11}

# Set up the graphics file, given filename and tag family
def set_graphics(fname, family):
    global FTYPE, IMG_WD, IMG_HT, SCALE, DWG_SIZE, VIEW_BOX
    FTYPE = fname.split('.')[-1].upper()
    FTYPE = FTYPE.replace("PGM", "PPM").replace("JPG", "JPEG")
    IMG_HT = int(math.sqrt(family[0])) + 6
    IMG_WD = (NTAGS-1)*TAG_PITCH + IMG_HT

    # Vector definitions
    if FTYPE == "SVG":
        SCALE     = 2
        DWG_SIZE  = "%umm"%(IMG_WD*SCALE),"%umm"%(IMG_HT*SCALE)
        VIEW_BOX  = "0 0 %u %s" % (IMG_WD, IMG_HT)

    # Bitmap definitions
    else:
        SCALE = 10

# Generate a tag with the given value, return a numpy array
def gen_tag(tag, val):
    area, minham, codes = tag
    dim = int(math.sqrt(area))
    d = np.frombuffer(np.array(codes[val], ">i8"), np.uint8)
    bits = np.unpackbits(d)[-area:].reshape((-1,dim))
    bits = np.pad(bits, 1, 'constant', constant_values=0)
    return np.pad(bits, 2, 'constant', constant_values=1)

# Save numpy arrays as a bitmap
def save_bitmap(fname, arrays):
    img = Image.new('L', (IMG_WD,IMG_HT), WHITE)
    for i,a in enumerate(arrays):
        t = Image.fromarray(a * WHITE)
        img.paste(t, (i*TAG_PITCH,0))
    img = img.resize((IMG_WD*SCALE, IMG_HT*SCALE))
    img.save(fname, FTYPE)

# Save numpy arrays as a vector file
def save_vector(fname, arrays):
    dwg = svgwrite.Drawing(fname, DWG_SIZE, viewBox=VIEW_BOX, debug=False)
    for i,a in enumerate(arrays):
        g = dwg.g(stroke='none', fill='black')
        for dy,dx in np.column_stack(np.where(a == 0)):
            g.add(dwg.rect((i*TAG_PITCH + dx, dy), (1, 1)))
        dwg.add(g)
    dwg.save(pretty=True)

if __name__ == '__main__':
    opt = None
    for arg in sys.argv[1:]:    # Process command-line arguments..
        if arg[0]=="-":
            opt = arg.lower()
        else:
            if opt == '-f':     # '-f family': tag family
                family = arg
            else: 
                filename = arg  # 'filename': graphics file  
            opt = None
    if family not in tag_families:
        print("Unknown tag family: '%s'" % family)
        sys.exit(1)
    tagdata = tag_families[family]
    set_graphics(filename, tagdata)
    print("Creating %s, file %s" % (family, filename))
    tags = [gen_tag(tagdata, n) for n in range(0, NTAGS)]
    if FTYPE == "SVG":
        save_vector(filename, tags)
    else:
        save_bitmap(filename, tags)

Decoding Apriltags

For the decoder, I’m using the standard Apriltag ‘C’ code, which includes a Python library, so no knowledge of the C programming language is required. The code is Linux-specific, so will run on the Raspberry Pi, but not on Windows unless you install the Microsoft ‘Windows Subsystem for Linux’, which can compile & run the text-based decoder, but sadly not the graphical display.

On the raspberry pi, I’m using the Raspbian Buster distribution; the Apriltag build process may not be compatible with older distributions. I’ve had no success building on a Pi Zero, due to the RAM size being too small, so had to compile on a larger board, and transfer the files across.

The commands to fetch and compile the code are:

sudo apt install cmake
cd ~
git clone https://github.com/AprilRobotics/apriltag
cd apriltag
cmake .
make
sudo make install
make apriltag_demo

The installation command returns an error with the Python library, but succeeds in installing the other application files.

You can now run my Python tag encoder, and feed the output into the demonstration decoder supplied in the Apriltag package, for example:

python3 apriltag_gen.py -f tag16h5 test.jpg
apriltag_demo -f tag16h5 test.jpg

You should be rewarded with a swathe of text, such as:

loading test.jpg
 detection   0: id (16x 5)-0   , hamming 0, margin  203.350
 detection   1: id (16x 5)-1   , hamming 0, margin  246.072
 detection   2: id (16x 5)-2   , hamming 0, margin  235.426
 ..and so on..

The -0, -1, -2 sequence shows the decoded tag numbers, and the large ‘margin’ value indicates there is a high degree of confidence that the decode is correct. The time taken by the various decoder components is also displayed, which is useful if you’re trying to optimise the code.

If the decode fails, check that you’ve entered the tag family & filename correctly; the decoder application doesn’t accept JPEG files with a .jpeg extension, it has to be .jpg.

Python tag decoder

To use the Python library interface, you have to tell Python where to find the library file, for example at the command prompt:

export PYTHONPATH=${PYTHONPATH}:${HOME}/apriltag
export LD_LIBRARY_PATH=${LD_LIBRARY_PATH}:${HOME}/apriltag/lib

This can be a bit of a nuisance; a quick (but rather inefficient) alternative is to copy the ‘.so’ library file from the compiled Apriltag package into the current directory. For my current build, the command would be:

cp ~/apriltag/apriltag.cpython-37m-arm-linux-gnueabihf.so .

You can now run a simple Python console program to exercise the library. It uses Python OpenCV, which needs to be installed using ‘apt’; see this blog for more information. File apriltag_decode.py:

# Simple test of Apriltag decoding from iosoft.blog

import cv2
from apriltag import apriltag

fname = 'test.jpg'
image = cv2.imread(fname, cv2.IMREAD_GRAYSCALE)
detector = apriltag("tag16h5")
dets = detector.detect(image)
for det in dets:
    print("%s: %6.1f,%6.1f" % (det["id"], det["center"][0], det["center"][1]))

You will need to run this under python3, as the Apriltag library isn’t compatible with Python 2.x. The output is somewhat uninspiring, just showing the tag value, and the x & y positions of its centre, but is sufficient to show the decoder is working:

0:   49.9,  49.9
1:  149.9,  49.8
2:  249.9,  49.9
..and so on..

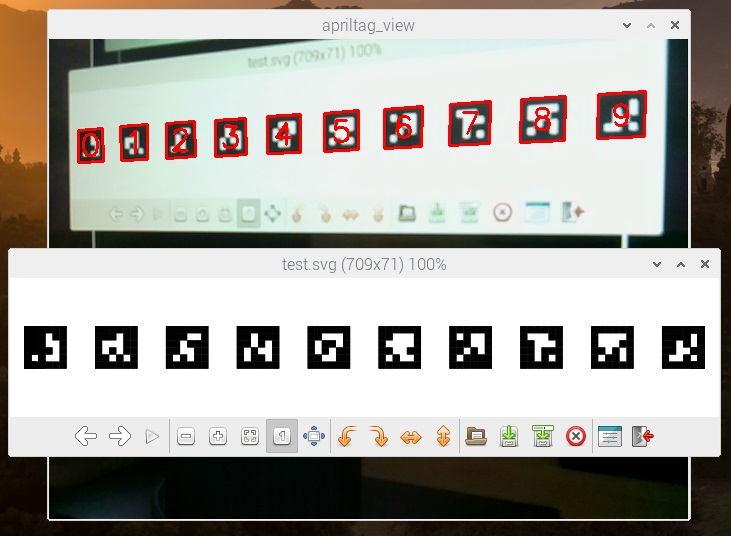
Graphical display of detected tags

A better test is to take video from the Raspberry Pi camera, detect the value and position of the tags, and overlay that information onto the display. Here is the source code (apriltag_view.py):

# Detect Apriltag fiducials in Raspbery Pi camera image
# From iosoft.blog

import cv2
from apriltag import apriltag

TITLE      = "apriltag_view"  # Window title
TAG        = "tag16h5"        # Tag family
MIN_MARGIN = 10               # Filter value for tag detection
FONT       = cv2.FONT_HERSHEY_SIMPLEX  # Font for ID value
RED        = 0,0,255          # Colour of ident & frame (BGR)

if __name__ == '__main__':
    cam = cv2.VideoCapture(0)
    detector = apriltag(TAG)
    while cv2.waitKey(1) != 0x1b:
        ret, img = cam.read()
        greys = cv2.cvtColor(img, cv2.COLOR_BGR2GRAY)
        dets = detector.detect(greys)
        for det in dets:
            if det["margin"] >= MIN_MARGIN:
                rect = det["lb-rb-rt-lt"].astype(int).reshape((-1,1,2))
                cv2.polylines(img, [rect], True, RED, 2)
                ident = str(det["id"])
                pos = det["center"].astype(int) + (-10,10)
                cv2.putText(img, ident, tuple(pos), FONT, 1, RED, 2)
        cv2.imshow(TITLE, img)
    cv2.destroyAllWindows()

To test the code, create a tag16h5 file in SVG format:

 python3 apriltag_gen.py -f tag16h5 test.svg

This vector file can be printed out using Inkscape, to provide an accurately-sized set of paper tags, or just displayed on the Raspberry Pi screen, by double-clicking in File Manager. Then run apriltag_view:

python3 apriltag_view.py

With the camera pointed at the screen, you can position the decoded images and original tags so they are both in view. Note that the camera doesn’t need to be at right-angles to the screen, the decoder can handle oblique images. The MIN_MARGIN value may need to be adjusted; it can be increased to suppress erroneous detections, but then some distorted tags may be missed.

To terminate the application, press the ESC key while the decoder display has focus.

The application is a bit slower than I’d like, with a noticeable lag on the image display, so the code needs to be optimised.

Copyright (c) Jeremy P Bentham 2019. Please credit this blog if you use the information or software in it.

Accurate position measurement using low-cost cameras and OpenCV

There are many ways to sense the position of an object, and they’re generally either expensive or low-resolution. Laser interferometers are incredibly accurate, but the complex optics & electronics make the price very high. Hand-held laser measures are quite cheap, but they use a time-of-flight measurement method which limits their resolution, as light travels at roughly 1 foot (300 mm) per nanosecond, and making sub-nanosecond measurements isn’t easy (but do check out my post on Ultra Wideband ranging, which does use lightspeed measurements). Lidar (light-based radar) is currently quite expensive, and has similar constraints. Ultrasonic methods benefit from the fact that sound waves travel at a much slower speed; they work well in constrained environments, such as measuring the height of liquid in a tank, but multipath reflections are a problem if there is more than one object in view.

Thanks to the smartphone boom, high-resolution camera modules are quite cheap, and I’ve been wondering whether they could be used to sense the position of an object to a reasonable accuracy for everyday measurements (at least 0.5 mm or 0.02 inches).

To test the idea I’ve set up 2 low-cost webcams at right-angles, to sense the X and Y position of an LED. To give a reproducible setup, I’ve engraved a baseboard with 1 cm squares, and laser-cut a LED support, so I can accurately position the LED and see the result.

The webcams are Logitech C270, that can provide an HD video resolution of 720p (i.e. 1280 x 720 pixels). For image analysis I’ll be using Python OpenCV; it has a wide range of sophisticated software tools, that allow you to experiment with some highly advanced methods, but for now I’ll only be using a few basic functions.

The techniques I’m using are equally applicable to single-camera measurements, e.g. tracking the position of the sun in the sky.

Camera input

My camera display application uses PyQt and OpenCV to display camera images, and it is strongly recommended that you start with this, to prove that your cameras will work with the OpenCV drivers. It contains code that can be re-used for this application, so is imported as a module.

Since we’re dealing with multiple cameras and displays, we need a storage class to house the data.

import sys, time, threading, cv2, numpy as np
import cam_display as camdisp

IMG_SIZE    = 1280,720          # 640,480 or 1280,720 or 1920,1080
DISP_SCALE  = 2                 # Scaling factor for display image
DISP_MSEC   = 50                # Delay between display cycles
CAP_API     = cv2.CAP_ANY       # API: CAP_ANY or CAP_DSHOW etc...

# Class to hold capture & display data for a camera
class CamCap(object):
    def __init__(self, cam_num, label, disp):
        self.cam_num, self.label, self.display = cam_num, label, disp
        self.imageq = camdisp.Queue.Queue()
        self.pos = 0
        self.cap = cv2.VideoCapture(self.cam_num-1 + CAP_API)
        self.cap.set(cv2.CAP_PROP_FRAME_WIDTH, IMG_SIZE[0])
        self.cap.set(cv2.CAP_PROP_FRAME_HEIGHT, IMG_SIZE[1])

The main window of the GUI is subclassed from cam_display, with the addition of a second display area, and storage for the camera capture data:

# Main window
class MyWindow(camdisp.MyWindow):
    def __init__(self, parent=None):
        camdisp.MyWindow.__init__(self, parent)
        self.label.setFont(LABEL_FONT)
        self.camcaps = []
        self.disp2 = camdisp.ImageWidget(self)
        self.displays.addWidget(self.disp2)
        self.capturing = True

On startup, 2 cameras are added to the window:

if __name__ == '__main__':
    app = camdisp.QApplication(sys.argv)
    win = MyWindow()
    win.camcaps.append(CamCap(2, 'x', win.disp))
    win.camcaps.append(CamCap(1, 'y', win.disp2))
    win.show()
    win.setWindowTitle(VERSION)
    win.start()
    sys.exit(app.exec_())

As with cam_display, a separate thread is used to fetch data from the cameras:

    # Grab camera images (separate thread)
    def grab_images(self):
        while self.capturing:
            for cam in self.camcaps:
                if cam.cap.grab():
                    retval, image = cam.cap.retrieve(0)
                    if image is not None and cam.imageq.qsize() < 2:
                        cam.imageq.put(image)
                    else:
                        time.sleep(DISP_MSEC / 1000.0)
                else:
                    print("Error: can't grab camera image")
                    self.capturing = False
        for cam in self.camcaps:
            cam.cap.release()

Image display

A timer event is used to fetch the image from the queue, convert it to RGB, do the image processing, and display the result.

    # Fetch & display camera images
    def show_images(self):
        for cam in self.camcaps:
            if not cam.imageq.empty():
                image = cam.imageq.get()
                if image is not None and len(image) > 0:
                    img = cv2.cvtColor(image, cv2.COLOR_BGR2RGB)
                    cam.pos = colour_detect(img)
                    self.display_image(img, cam.display, DISP_SCALE)
                    self.show_positions()
    
    # Show position values given by cameras
    def show_positions(self, s=""):
        for cam in self.camcaps:
            s += "%s=%-5.1f " % (cam.label, cam.pos)
        self.label.setText(s)

Image processing

We need to measure the horizontal (left-to-right) position of the LED for each camera. If the LED is brighter than the surroundings, this isn’t difficult; first we create a mask that isolates the LED from the background, then extract the ‘contour’ of the object with the background masked off. The contour is a continuous curve that marks the boundary between the object and the background; for the illuminated LED this will approximate to a circle. To find an exact position, the contour is converted to a true circle, which is drawn in yellow, and the horizontal position of the circle centre is returned.

LOWER_DET   = np.array([240,  0,  0])       # Colour limits for detection
UPPER_DET   = np.array([255,200,200])

# Do colour detection on image
def colour_detect(img):
    mask = cv2.inRange(img, LOWER_DET, UPPER_DET)
    ctrs = cv2.findContours(mask, cv2.RETR_TREE,
                            cv2.CHAIN_APPROX_SIMPLE)[-2]
    if len(ctrs) > 0:
        (x,y),radius = cv2.minEnclosingCircle(ctrs[0])
        radius = int(radius)
        cv2.circle(img, (int(x),int(y)), radius, (255,255,0), 2)
        return x
    return 0

This code is remarkably brief, and if you’re thinking that I may have taken a few short-cuts, you’d be right:

Colour detection: I’ve specified the upper and lower RGB values that are acceptable; because this is a red LED, the red value is higher than the rest, being between 240 and 255 (the maximum is 255). I don’t want to trigger on a pure white background so I’ve set the green and blue values between 0 and 200, so a pure white (255,255,255) will be rejected. This approach is a bit too simplistic; if the LED is too bright it can saturate the sensor and appear completely white, and conversely another bright light source can cause the camera’s auto-exposure to automatically reduce the image intensity, such that the LED falls below the required level. The normal defence against this is to use manual camera exposure, which can be adjusted to your specific environment. Also it might be worth changing the RGB colourspace to HSV for image matching; I haven’t yet tried this.

Multiple contours: the findContours function returns a list of contours, and I’m always taking the first of these. In a real application, there may be several contours in the list, and it will be necessary to check them all, to find the most likely – for example, the size of the circle to see if it is within an acceptable range.

However, the measurement method does show some very positive aspects:

Complex background: as you can see from the image at the top of this blog, it works well in a normal office environment – no need for a special plain-colour background.

No focussing: most optical applications require the camera to be focussed, but in this case there is no need. I’ve deliberately chosen a target distance of approximately 4 inches (100 mm) that results in a blurred image, but OpenCV is still able to produce an accurate position indication.

Sub-pixel accuracy: with regard to measurement accuracy, the main rule for the camera is obviously “the more pixels, the better”, but also OpenCV can compute the position to within a fraction of a pixel. My application displays the position (in pixels) to one decimal place; at 4 inches (100 mm) distance, the Logitech cameras’ field of view is about 3.6 inches (90 mm), so if the position can be measured within, say, 0.2 of a pixel, this would be a resolution of 0.0006 inch (0.015 mm).

Of course these figures are purely theoretical, and the resolution will be much reduced in a real-world application, but all the same, it does suggest the technique may be capable of achieving quite good accuracy, at relatively low cost.

Single camera

With minor modifications, the code can be used in a single-camera application, e.g. tracking the position of the sun in the sky.

The code scans all the cameras in the ‘camcaps’ list, so will automatically adapt if there is only one.

The colour_detect function currently returns the horizontal position only; this can be changed to return the vertical as well. The show_positions method can be changed to display both of the returned values from the single camera.

Then you just need a wide-angle lens, and a suitable filter to stop the image sensor being overloaded. Sundial, anyone?

Source code

The ‘campos’ source code is available here, and is compatible with Windows and Linux, Python 2.7 and 3.x, PyQt v4 and v5. It imports my cam_display application, and I strongly recommended that you start by running that on its own, to check compatibility. If it fails, read the Image Capture section of that blog, which contains some pointers that might be of help.

Copyright (c) Jeremy P Bentham 2019. Please credit this blog if you use the information or software in it.

PC / RPi camera display using PyQt and OpenCV

OpenCV is an incredibly powerful image-processing tool, but it can be difficult to know where to start – how do you grab an image from a camera, and display it in a user-friendly GUI? This post describes such an application, that runs unmodified on a PC or Raspberry Pi, Windows or Linux, Python 2.7 or 3.x, and PyQt v4 or v5.

Installation

On Windows, the OpenCV and PyQt5 libraries can be installed using pip:

pip install numpy opencv-python PyQt5

If pip isn’t available, you should be able to run the module from the command line by invoking Python, e.g. for Python 3:

py -3 -m pip install numpy opencv-python PyQt5

Installing on a Raspberry Pi is potentially a lot more complicated; it is generally recommended to install from source, and for opencv-python, this is a bit convoluted. Fortunately there is a simpler option, if you don’t mind using versions that are a few years old, namely to load the binary image from the standard repository, e.g.

sudo apt update
sudo apt install python3-opencv python3-pyqt5 

At the time of writing, the most recent version of Raspbian Linux is ‘buster’, and that has OpenCV 3.2, which is quite usable. The previous ‘stretch’ distribution has python-opencv version 2.4, which is a bit too old: my code isn’t compatible with it.

With regard to cameras, all the USB Webcams I’ve tried have worked fine on Windows without needing to have any extra driver software installed; they also work on the Raspberry Pi, as well as the standard Pi camera with the ribbon-cable interface.

PyQt main window

Being compatible with PyQt version 4 and 5 requires some boilerplate code to handle the way some functions have been moved between libraries:

import sys, time, threading, cv2
try:
    from PyQt5.QtCore import Qt
    pyqt5 = True
except:
    pyqt5 = False
if pyqt5:
    from PyQt5.QtCore import QTimer, QPoint, pyqtSignal
    from PyQt5.QtWidgets import QApplication, QMainWindow, QTextEdit, QLabel
    from PyQt5.QtWidgets import QWidget, QAction, QVBoxLayout, QHBoxLayout
    from PyQt5.QtGui import QFont, QPainter, QImage, QTextCursor
else:
    from PyQt4.QtCore import Qt, pyqtSignal, QTimer, QPoint
    from PyQt4.QtGui import QApplication, QMainWindow, QTextEdit, QLabel
    from PyQt4.QtGui import QWidget, QAction, QVBoxLayout, QHBoxLayout
    from PyQt4.QtGui import QFont, QPainter, QImage, QTextCursor
try:
    import Queue as Queue
except:
    import queue as Queue

The main window is subclassed from PyQt, with a simple arrangement of a menu bar, video image, and text box:

class MyWindow(QMainWindow):
    text_update = pyqtSignal(str)

    # Create main window
    def __init__(self, parent=None):
        QMainWindow.__init__(self, parent)

        self.central = QWidget(self)
        self.textbox = QTextEdit(self.central)
        self.textbox.setFont(TEXT_FONT)
        self.textbox.setMinimumSize(300, 100)
        self.text_update.connect(self.append_text)
        sys.stdout = self
        print("Camera number %u" % camera_num)
        print("Image size %u x %u" % IMG_SIZE)
        if DISP_SCALE > 1:
            print("Display scale %u:1" % DISP_SCALE)

        self.vlayout = QVBoxLayout()        # Window layout
        self.displays = QHBoxLayout()
        self.disp = ImageWidget(self)    
        self.displays.addWidget(self.disp)
        self.vlayout.addLayout(self.displays)
        self.label = QLabel(self)
        self.vlayout.addWidget(self.label)
        self.vlayout.addWidget(self.textbox)
        self.central.setLayout(self.vlayout)
        self.setCentralWidget(self.central)

        self.mainMenu = self.menuBar()      # Menu bar
        exitAction = QAction('&Exit', self)
        exitAction.setShortcut('Ctrl+Q')
        exitAction.triggered.connect(self.close)
        self.fileMenu = self.mainMenu.addMenu('&File')
        self.fileMenu.addAction(exitAction)

There is a horizontal box layout called ‘displays’, that seems to be unnecessary as it only has one display widget in it. This is intentional, since much of my OpenCV experimentation requires additional displays to show the image processing in action; this can easily be done by creating more ImageWidgets, and adding them to the ‘displays’ layout.

Similarly, there is a redundant QLabel below the displays, which isn’t currently used, but is handy for displaying static text below the images.

Text display

It is convenient to redirect the ‘print’ output to the text box, rather than appearing on the Python console. This is done using the ‘text_update’ signal that was defined above:

    # Handle sys.stdout.write: update text display
    def write(self, text):
        self.text_update.emit(str(text))
    def flush(self):
        pass

    # Append to text display
    def append_text(self, text):
        cur = self.textbox.textCursor()     # Move cursor to end of text
        cur.movePosition(QTextCursor.End) 
        s = str(text)
        while s:
            head,sep,s = s.partition("\n")  # Split line at LF
            cur.insertText(head)            # Insert text at cursor
            if sep:                         # New line if LF
                cur.insertBlock()
        self.textbox.setTextCursor(cur)     # Update visible cursor

The use of a signal means that print() calls can be scattered about the code, without having to worry about which thread they’re in.

Image capture

A separate thread is used to capture the camera images, and put them in a queue to be displayed. The camera may produce images faster than they can be displayed, so it is necessary to check how many images are already in the queue; if more than 1, the new image is discarded. This prevents a buildup of unwanted images.

IMG_SIZE    = 1280,720          # 640,480 or 1280,720 or 1920,1080
CAP_API     = cv2.CAP_ANY       # or cv2.CAP_DSHOW, etc...
EXPOSURE    = 0                 # Non-zero for fixed exposure

# Grab images from the camera (separate thread)
def grab_images(cam_num, queue):
    cap = cv2.VideoCapture(cam_num-1 + CAP_API)
    cap.set(cv2.CAP_PROP_FRAME_WIDTH, IMG_SIZE[0])
    cap.set(cv2.CAP_PROP_FRAME_HEIGHT, IMG_SIZE[1])
    if EXPOSURE:
        cap.set(cv2.CAP_PROP_AUTO_EXPOSURE, 0)
        cap.set(cv2.CAP_PROP_EXPOSURE, EXPOSURE)
    else:
        cap.set(cv2.CAP_PROP_AUTO_EXPOSURE, 1)
    while capturing:
        if cap.grab():
            retval, image = cap.retrieve(0)
            if image is not None and queue.qsize() < 2:
                queue.put(image)
            else:
                time.sleep(DISP_MSEC / 1000.0)
        else:
            print("Error: can't grab camera image")
            break
    cap.release()

The choice of image size will depend on the camera used; all cameras support VGA size (640 x 480 pixels), more modern versions the high-definition standards of 720p (1280 x 720) or 1080p (1920 x 1080).

The camera number refers to the position in the list of cameras collected by the operating system; I’ve defined the first camera as number 1, but the OpenCV call defines the first as 0, so the number has to be adjusted.

The same parameter is also used to define the capture API setting; by default this is ‘any’, which usually works well; my Windows 10 system defaults to the MSMF (Microsoft Media Foundation) backend, while the Raspberry Pi defaults to Video for Linux (V4L). Sometimes you may need to force a particular API to be used, for example, I have a Logitech C270 webcam that works fine on Windows 7, but fails on Windows 10 with an ‘MSMF grab error’. Forcing the software to use the DirectShow API (using the cv2.CAP_DSHOW option) fixes the problem.

If you want to check which backend is being used, try:

print("Backend '%s'" % cap.getBackendName())

Unfortunately this only works on the later revisions of OpenCV.

Manual exposure setting can be a bit hit-and-miss, depending on the camera and API you are using; the default is automatic operation, and setting EXPOSURE non-zero (e.g. to a value of -3) generally works, however it can be difficult to set a webcam back to automatic operation: sometimes I’ve had to use another application to do this. So it is suggested that you keep auto-exposure enabled if possible.

[Supplementary note: it seems that these parameter values aren’t standardised across the backends. For example, the CAP_PROP_AUTO_EXPOSURE value in my source code is correct for the MSMF backend; a value of 1 enables automatic exposure, 0 disables it. However, the V4L backend on the Raspberry Pi uses the opposite values: automatic is 0, and manual is 1. So it looks like my code is incorrect for Linux. I haven’t yet found any detailed documentation for this, so had to fall back on reading the source code, namely the OpenCV videoio ‘cap’ files such as cap_msmf.cpp and cap_v4l.cpp.]

Image display

The camera image is displayed in a custom widget:

# Image widget
class ImageWidget(QWidget):
    def __init__(self, parent=None):
        super(ImageWidget, self).__init__(parent)
        self.image = None

    def setImage(self, image):
        self.image = image
        self.setMinimumSize(image.size())
        self.update()

    def paintEvent(self, event):
        qp = QPainter()
        qp.begin(self)
        if self.image:
            qp.drawImage(QPoint(0, 0), self.image)
        qp.end()

A timer event is used to trigger a scan of the image queue. This contains images in the camera format, which must be converted into the PyQt display format:

DISP_SCALE  = 2                 # Scaling factor for display image

    # Start image capture & display
    def start(self):
        self.timer = QTimer(self)           # Timer to trigger display
        self.timer.timeout.connect(lambda: 
                    self.show_image(image_queue, self.disp, DISP_SCALE))
        self.timer.start(DISP_MSEC)         
        self.capture_thread = threading.Thread(target=grab_images, 
                    args=(camera_num, image_queue))
        self.capture_thread.start()         # Thread to grab images

    # Fetch camera image from queue, and display it
    def show_image(self, imageq, display, scale):
        if not imageq.empty():
            image = imageq.get()
            if image is not None and len(image) > 0:
                img = cv2.cvtColor(image, cv2.COLOR_BGR2RGB)
                self.display_image(img, display, scale)

    # Display an image, reduce size if required
    def display_image(self, img, display, scale=1):
        disp_size = img.shape[1]//scale, img.shape[0]//scale
        disp_bpl = disp_size[0] * 3
        if scale > 1:
            img = cv2.resize(img, disp_size, 
                             interpolation=cv2.INTER_CUBIC)
        qimg = QImage(img.data, disp_size[0], disp_size[1], 
                      disp_bpl, IMG_FORMAT)
        display.setImage(qimg)

This demonstrates the power of OpenCV; with one function call we convert the image from BGR to RGB format, then another is used to resize the image using cubic interpolation. Finally a PyQt function is used to convert from OpenCV to PyQt format.

Running the application

Make sure you’re using the Python version that has the OpenCV and PyQt installed, e.g. for the Raspberry Pi:

python3 cam_display.py

There is an optional argument that can be used if there are multiple cameras; the default first camera is number 1.

On Linux, some USB Webcams cause a constant stream of JPEG format errors to be printed on the console, complaining about extraneous bytes in the data. There is some discussion online as to the cause of the error, and the cure seems to involve rebuilding the libraries from source; I’m keen to avoid that, so used the simple workaround of suppressing the errors by redirecting STDERR to null:

python3 cam_display.py 2> /dev/null

Fortunately this workaround is only needed with some USB cameras; the standard Raspberry Pi camera with the CSI ribbon-cable interface works fine.

Source code

Full source code is available here.

For a more significant OpenCV application, take a look at this post.

Copyright (c) Jeremy P Bentham 2019. Please credit this blog if you use the information or software in it.