

To debug embedded systems, such as those with the Raspberry Pi Pico processor, normally only two options are available: using ‘print’ statements, or a debug utility such as GDB. This project offers an alternative, which isn’t as invasive as the ‘print’ method, and isn’t as complex as GDB. It basically provides an insight as to the functioning of the processor and peripherals, while they are running – the CPU need not be halted to do the measurements, and the indications are equally relevant for C or Python programs.
Sadly, I can’t promise that this utility will automatically find bugs in your code; in operation, it is more like a test meter that is used to check the voltages and currents in an electrical circuit; it will show you what is going on, and give you pointers to the hardware or software areas that might be malfunctioning.
There are major differences between the on-chip debug resources for the RP2040 and RP2350; the latter is far more complex, with the potential for using much more sophisticated debug techniques. However, at the time of writing, the RP2350 is still quite a new processor, and has not yet achieved widespread usage. So the current version of PicoReg concentrates on debug features that are common to both devices; later versions will make use of the advanced features of the RP2350 to provide more sophisticated debug capabilities.
For ease of use, the PicoReg utility is written in pure Python, so it will run on a Windows or Linux PC, or a Raspberry Pi board. The interface to the target CPU is via the standard low-cost Raspberry Pi Debug Probe, with a USB interface to the PC or Pi, and a 3-wire SWD interface to the target system.
Connecting the target system
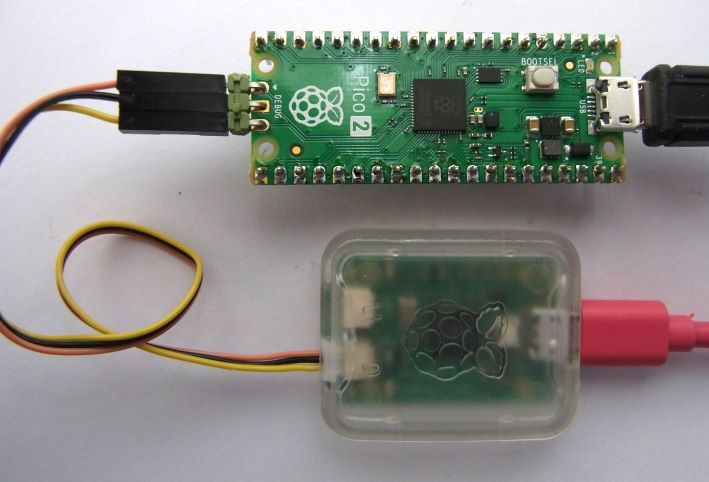
Connect the target system to the debug probe as described in the Raspberry Pi documentation, either using a 3-pin 0.1 inch pitch header as shown above, or the 3-pin miniature JST connector that is fitted to the ‘H’ variants of the Pico boards (e.g. RP2040H). It is important to keep the SWD cable short, ideally a maximum of 6 inches or 15 cm, with a good ground connection, since the signals are quite fast (10 MHz).
The Pi Debug Probe has an ARM-standard ‘CMSIS-DAP’ USB interface, and you can find other low-cost CMSIS-DAP probes online, however they probably won’t work without significant modifications to the Python code, so are not recommended.
A benefit to this setup is that it is exactly the same as used with OpenOCD, so is compatible with all the standard Pico software tools; you don’t need to re-plug the target system when switching between programming and debugging.
Installing PicoReg
The source code can be found on github here and can be copied into any convenient directory.
The files are:
picoreg.py:            main program
picoreg_disp.py:       display code
picoreg_swd.py:        SWD interface
picoreg_arm.py:        ARM CPU interface
rp2040.svd:            ARM register definitions for RP2040
rp2350.svd:            ARM register definitions for RP2350
icons/led_red_off.png: icon for I/O display
icons/led_red_on.png:  icon for I/O display
The register definition files have been taken directly from the Pico SDK, and have been provided as a convenience; they can be replaced with more up-to-date versions from the SDK, but do ensure the filenames are all in lower-case.
It is necessary to install PyQt5, pyusb, and libusb_package, e.g. for Linux:
python -m pip install PyQt5
git clone https://github.com/pyusb/pyusb
cd pyusb
sudo python setup.py install
python -m pip install libusb_package

If debug probe lacks the necessary access permission, create /etc/udev/rules.d/50-usb-cmsis.rules with the following line:
  SUBSYSTEM=="usb", ATTR{idVendor}=="2e8a", ATTRS{idProduct}=="000c", MODE="0666"
On newer Linux systems, the pip install method may fail with the error message “This environment is externally managed” . You can find guidance online as to the correct method of handling this error; the simplest way is to override package management by appending ‘–break-system-packages’ to the pip command.
To check the USB connection to the probe, and the SWD connection to the CPU, run
python picoreg_swd.py
The response should be:
If working OK:
Found debug probe (CMSIS-DAP)
CPU ID 0BC12477 [for RP2040, or 4C013477 for RP2350]

If target board disconnected or powered down:
Target not responding

If debug probe not connected:
Probe not found
The code can be run on any Pi Linux system, but it is recommended that a Pi4 or later be used, otherwise the user interface may be a bit sluggish.
Running PicoReg
PicoReg is run using:
python picroreg.py
If all is well, the CPU type (RP2040 / RP2350) should be auto-detected, the appropriate SVD definition file will be parsed, and displayed in tree format.
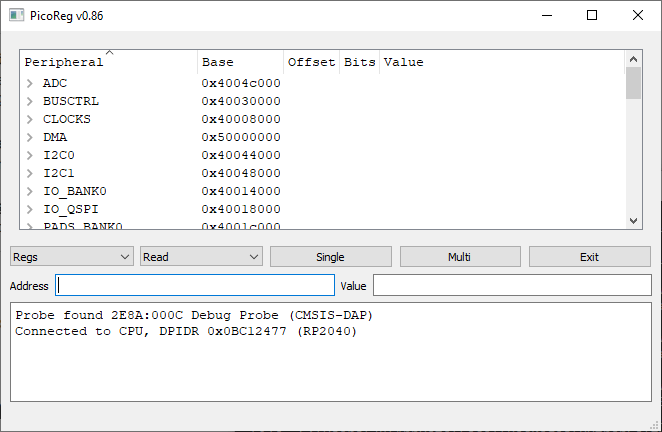
By default, the peripheral names are sorted alphabetically; clicking on another heading will change the sorting, e.g. ‘base’ to sort by base address.
The first control (showing ‘Regs’) has a drop-down list of the various operational modes:

Regs:   Show all the CPU registers in tree format
I/O:    Display the on/off state and mode of the I/O pins
CPU:    View some of the CPU registers
Mem:    Display a block of memory or registers at a given address
PIO:    Show some of the PIO-specific registers
DMA:    Show some of the DMA-specific registers
The Regs, PIO and DMA modes are very similar, only differing in the number of registers on display. Regs mode displays the full set as defined in the SVD file, the other 2 modes show only a subset, which can make it easier to understand the operation of the selected peripheral.
The I/O display uses LED icons and text to display the state of all 29 I/O pins:
This shows the display for a typical ‘blinking LED’ program; the on-board LED on pin 25 blinks on and off, under the control of the SIO peripheral. The only other pins being controlled are pin 0 and 1, which are under the control of UART0 (asynchronous serial transmit and receive).
CPU mode shows some of the processor registers, which can be useful to check that it is running (not crashed) and give an indication of activity.

This shows that the code is running in Flash memory (10000000 hex onwards) with the stack in RAM (20000000 hex onwards).
Mem mode is used to display arbitrary areas of memory or registers (since the registers are memory-mapped).

This shows a small block of RAM that acting as a WiFi data buffer.
The second drop-down list selects the access mode:
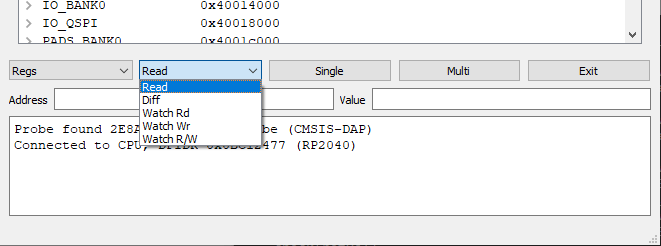
Read:      Display read value
Diff:      Add the current value to a list, when the value changes
Watch Rd:  Set data watchpoint, display data on CPU write cycle
Watch Rd:  Set data watchpoint, display data on CPU read cycle
Watch R/W: Set data watchpoint, display data when CPU read or write cycle
The Read and Diff modes rely on continuous polling of the target system, at approximately 1000 times per second, so they can not capture fast changing signals. The Watch modes use the CPU hardware to detect changes, so a single rapid change will be detected, but there is a finite delay before the PC can capture the data values and re-check for another change, so multiple rapid events will not all be captured.
The ‘single’ button does one read cycle, and the ‘multi’ button runs continuous cycles until that button is pressed again.
Command-line options
Running ‘python picoreg.py -h’ produces the following help:
python picoreg.py -h

usage: picoreg.py [-h] [-b] [-m MEM] [-n NBYTES] [-r REG] [-v] [-2]

optional arguments:
  -h, --help            show this help message and exit
  -b, --break           RP2350 break on watchpoint
  -m MEM, --mem MEM     Memory address
  -n NBYTES, --nbytes NBYTES
                        Number of bytes for hex dump
  -r REG, --reg REG     Register name
  -v, --verbose         Enable diagnostic display
  -2, --core2           Use second core
The options are:
- break: force the RP2350 to do a brief break on each watchpoint making its behaviour similar to the RP2040, which has to break on each watchpoint.
- mem: add a specific memory address to the display. This is useful when working with a C program; the compiler generates a map file with the address of all global variables, and this option can be used (one or more times) to add addresses to the display.
- nbytes: set the number of bytes to be displayed on a memory dump, the default value is 32.
- reg: select a specific register to be monitored. This is case-sensitive e.g. TIMER.TIMERAWL for RP2040, or TIMER0.TIMERAWL for RP2350
- verbose: display the raw CMSIS-DAP messages
- 2: select the second ARM core; the RP2350 RISC-V cores are not currently available
Copyright (c) Jeremy P Bentham 2025. Please credit this blog if you use the information or software in it.
