
This project provides a simple way of capturing data using a Pi PicoW, and displaying it wirelessly on a Web browser, as either as a logic analyser, or an oscilloscope.
The digital capture is done using the Pico I/O lines; the analogue capture uses an AD9226 parallel ADC module, that can provide up to 65 megasamples per second. The same firmware is used for both; for speed, the data is sent over the network as raw 16-bit values.
Hardware
In its simplest form, the only hardware required is a Pi PicoW module.

This can monitor 16 (or more) input lines, but it is essential that the voltage remains between 0 and 3.3V, otherwise damage will result. To accommodate wider voltages, an attenuator & comparator can be used, as in the EDLA project.
High-speed analog input uses a AD9226 ADC module, that is readily available online.
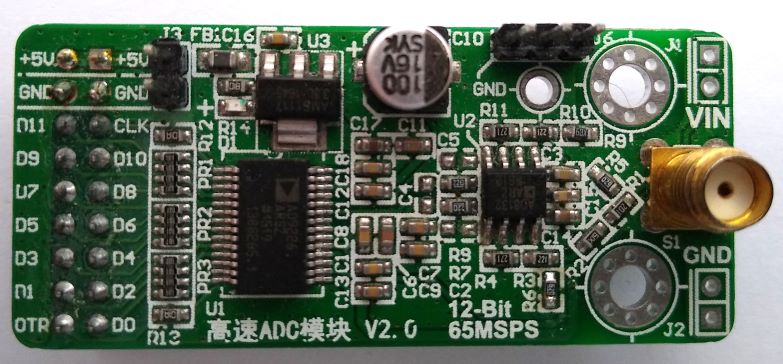
It requires a 5V supply, but can be directly connected to the Pico I/O lines.

Although the ADC has 12-bit resolution, only 10 bits have been used. It is possible to use all 12 bits, with minor changes to the software.
Note that some AD9226 modules have the most-significant pin marked as D0, not D11; if in doubt refer to the device datasheet, and do a continuity check between the IC pins and the I/O connections.
The ADC clock pin is connected to two I/O lines; the clock is generated on GPIO22, and read back on GPIO17. The latter is used to track the number of pulses emitted, using the pulse-counter function of the Rp2040 PWM peripheral. Any other available GPIO pins could be used instead, except that the pulse-counter function only works on odd pin numbers, so if GPIO17 is changed, it must be to an odd pin number.
When running the ADC at high speed, it is essential to keep the wiring to the Pico short (maximum 2 inches, or 5 cm) with good-quality supply & ground connections.
The analog input to the ADC module is probably 50 ohms, so can not be used with conventional oscilloscope probes. To avoid excessive loading of the input signal source, a buffer amplifier may be required.
There is a serial console output using UART1 at 115 Kbaud on GPIO pins 20 (transmit) and 21 (receive). This can be changed to use the USB link instead, by modifying the settings at the bottom of CMakeLists.txt.
Firmware
The Pico firmware is written in C; networking is implemented using the picowi WiFi driver, combined with the Mongoose TCP/IP stack; follow these links for more information. The source code is on github here.
An HTTP request is used to set the parameters and initiate a capture, e.g.
GET /status.txt?xsamp=1000&xrate=100000&cmd=1
This selects a sample count of 1000 and sample rate of 100 kHz, and the inclusion of the ‘cmd’ parameter initiates the capture.
The response is in JSON format, confirming the current state:
{"state":1,"nsamp":1000,"cmd":0,"xsamp":1000,"xrate":10000}
This confirms that 1000 samples have been captured, and are ready for transfer; if the capture is taking a long time, it will be necessary to poll the interface using a plain “GET /status.txt”, checking the ‘nsamp’ value to see when the capture is complete. If the long capture needs to be terminated, a status request with ‘cmd=0’ can be used.
The data is fetched using:
GET /status.bin
The response is a binary block with the appropriate number of 16-bit samples. For large blocks, the transfer rate is around 2 Mbyte/s.
At the time of writing, the network details are hard-coded in the firmware, so the file ‘mg_wifi.c’ needs to be edited, to change the default network name (SSID) and password.
It may also be necessary to change the network security setting, the options are:
WHD_SECURITY_WPA_TKIP_PSK,      WHD_SECURITY_WPA_AES_PSK,
WHD_SECURITY_WPA_MIXED_PSK,     WHD_SECURITY_WPA2_AES_PSK, WHD_SECURITY_WPA2_TKIP_PSK,     WHD_SECURITY_WPA2_MIXED_PSK,
WHD_SECURITY_WPA2_FBT_PSK,      WHD_SECURITY_WPA2_WPA_AES_PSK, WHD_SECURITY_WPA2_WPA_MIXED_PSK,WHD_SECURITY_WPA3_AES,
WHD_SECURITY_WPA3_WPA2_PSK
I have experienced difficulties with the auto-switching between protocol versions, e.g. WPA2_WPA and WPA3_WPA2; if in doubt, just use the PSK versions of WPA, WPA2 or WPA3.
When the unit powers up, the on-board LED will flash rapidly, and the serial console will display something similar to the following:
WiCap v0.26
Using dynamic IP (DHCP)
Detected WiFi chip
Loaded firmware addr 0x0000, len 228914 bytes
Loaded NVRAM addr 0x7FCFC len 768 bytes
MAC address 28:CD:C1:00:C7:D1
Joining network testnet
WiFi wl0: Nov 24 2022 23:10:29 version 7.95.59 (32b4da3 CY) FWID 01-f48003fb
Joining network testnet
WiFi wl0: Nov 24 2022 23:10:29 version 7.95.59 (32b4da3 CY) FWID 01-f48003fb
Joined network
IP state: UP
IP state: REQ
IP state: READY, IP: 192.168.43.78, GW: 192.168.43.1
The dynamic IP address will depend on the settings of your network Access Point.
Once the unit has connected to the WiFi network, the LED will flash more slowly (1 Hz), and it should respond to network pings. A quick test is to enter the unit’s IP address in the browser’s address bar, and the unit ID and software version should be displayed, e.g. ‘WiCap v0.26’
Display software
In the ‘test’ directory there is a Javascript application to request & display the data in analog (oscilloscope) or digital (logic analyser) mode.

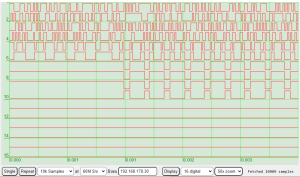
The controls are:
- Single / repeat: control the data acquisition, with single or multiple captures
- Sample count: number of samples required (max 100,000 for RP2040)
- Sample rate: frequency of capture, up to 60 MHz for a Pico with a 120 MHz clock.
- IP address: the address of the capture unit. This is printed out on the unit’s serial console at power-up.
- Display: retrieve data from the unit without starting a new capture cycle.
- Analogue/digital: select the number of logic analyser lines to display (8 or 16) or select the analog sensitivity (0.1, 0.2, 0.5 or 1.0 volts per division).
- Zoom: Select the current zoom level; the trace can be dragged left or right to the required position.
The display code is in the ‘test’ directory on github here.
Alternative client software
An easy way to upload the data for further processing is to use WGET, e.g.
wget http://192.168.1.2/data.bin
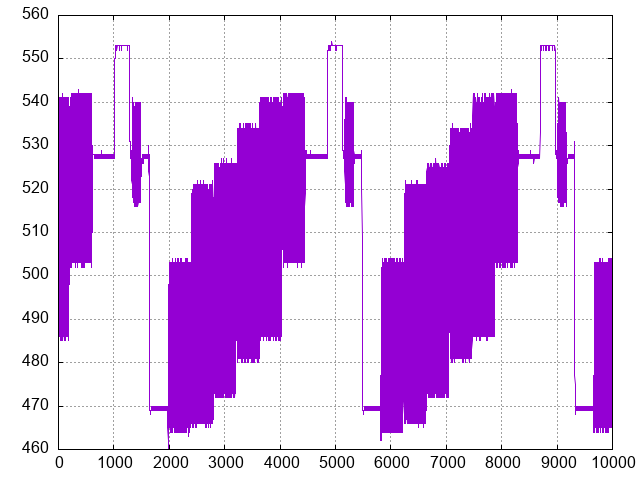
This returns a file containing 16-bit binary data. Then the data can, for example, be plotted using GNUPlot:
gnuplot -e "set term png; set output 'data.png'; set grid; unset key; plot 'data.bin' binary array=10000 format='%uword' with lines;"
Copyright (c) Jeremy P Bentham 2024. Please credit this blog if you use the information or software in it.
